Navigating Google Analytics 4
Google Analytics 4 (GA4) is no longer just an option; it’s the only option. With Universal Analytics phased out, everyone in the digital ecosystem is now on the GA4 platform. If you’re new to this or transitioning late, don’t worry. This guide will help you understand GA4, its new features, and why it’s essential for tracking your digital footprint.
Core Features
The Dashboard
Say goodbye to the clutter and hello to a refreshed, streamlined dashboard. Customisation is at its core, and if you’re a fan of Google Data Studio, you’ll be pleased to know that GA4 integrates seamlessly with it for tailored data visualisations.
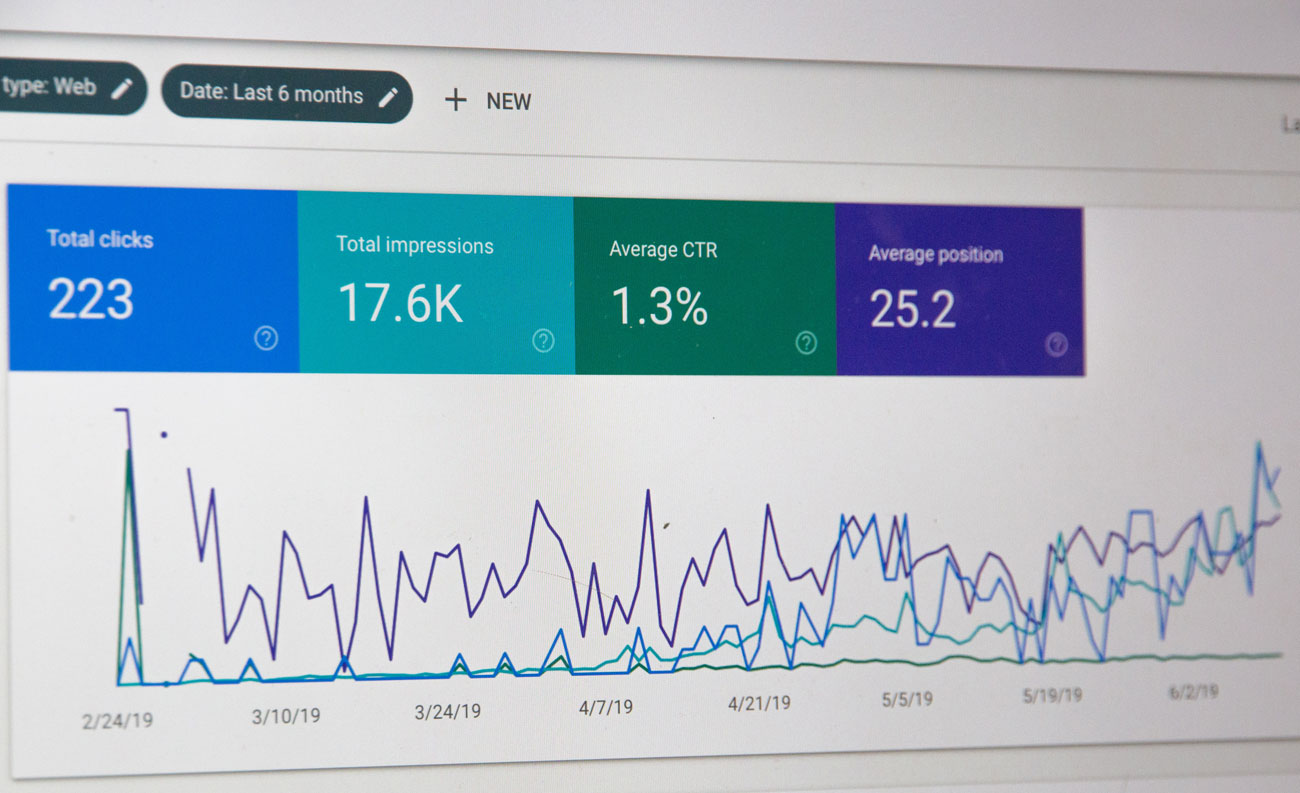
Events Over Page Views
Forget about page views as your primary metric; GA4 focuses on ‘events’. This perspective offers nuanced insights into user interactions, providing granular data that was previously hard to come by.
Cross-Platform Tracking
This is one of GA4’s cornerstone features. Unique user IDs allow GA4 to track the customer journey across websites and apps. This is essential in today’s multi-device world.
Why GA4 is Your Go-To Analytics Tool
Total Control
GA4 provides an unprecedented level of control. With the ability to customise your dashboard and set up trigger events, you can tailor your data tracking like never before.
Predictive Metrics
Unlike its predecessor, GA4 employs AI to provide predictive insights. Think metrics like ‘purchase probability’ and ‘churn rate’. This foresight enables you to strategise proactively.
Getting Started With GA4
If you’re late to the GA4 party, getting on board is crucial. Here’s a quick guide:
- You’ll need to create a Google Analytics account if you’re entirely new.
- Input your website details—name, URL, and industry sector.
- Set up a new GA4 property.
- Implement the new tracking code on your site, right after the head tag.
Set up a new GA4 property.
Implement the new tracking code on your site right after the head tag.
Note: If you were using Universal Analytics before its sunset, you’ll start fresh with GA4 data, so prepare for a new metrics baseline.
The phase-out of Universal Analytics may have left some businesses scrambling, but GA4 offers powerful capabilities that make the switch worth your while. More customisation, event-based tracking, and predictive analytics make it an indispensable tool for anyone serious about their digital strategy.
If you need help to make sense of this new landscape, Left Bank Design is here to help. We’ve got you covered from setup to deep dives into your analytics.